Methods and experimental techniques
Chudinovskikh L.T., Boehler R. A new technique for determing the yield strengths of mantle minerals.
key words [plasticity optical transmittance yield strength diamond anvil cell high pressure laser heating]
An investigation of plasticity of minerals and rocks is of vital importance for understanding the dynamics and processes of chemical evolution of the Earth.
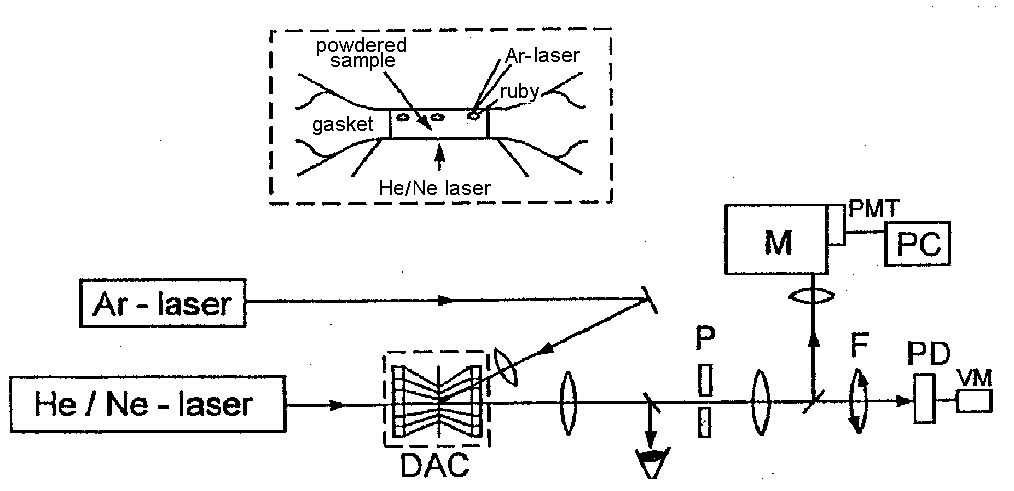
The novel nontraditional method of research on the rheologic properties of minerals and rocks under the high temperature-high pressure conditions equivalent to those in the interior of the Earth is based on a direct measurement of optical transmission of light through polycrystalline samples placed between diamond anvils, and estimation of yield strengths from the optical transmittance vs pressure curves. The specially designed optical set up (see Fig.1) enables the measurements of optical transmittance I/Io (where Io is the intensity of the laser beam that passed through the diamond anvil cell without a sample, I - with a sample), and pressure P (by the ruby - luminescence method) for every loading step of a diamond anvil cell. At the very beginning of squeezing a sample of the powded mineral positioned in the metallic gasket hole and locked between diamond anvils is opaque. Then near the gasket wall where the pressure is higher than in the center of the sample there appear a more transparent ring. Further loading leads to an increase of optical transmittance of every partion of the sample, the more transparent ring gradually expands and, finally, the sample gets completely transparent.
Due to radial pressure gradient that reflects the magnitude of differential stress and that acts in the direction from the gasket walls towards the sample center there arises the driving force of the plastic flow of a polycrystalline material. Inasmuch as the sample volume does not change after the lighter ring first occurred which is confirmed by careful measurements of the sample diameter and thickness of the metallic gasket under a microscope, the pressure value intermediate between the pressure value of the onset of light transmission and the one at which the maximum optical transmittance is observed can be used as the measure of the yield strength value. In our experiments the measurements on polycrystals are performed in the fully ductile region even at room temperature since the pressure of the onset of light transmission through the samples is much higher than the radial pressure gradient which reflects the magnitude of the differential stress i.e. beyond the brittle failure region.
The values of yield strengths were determined from the optical transmittance vs pressure curves (fig.2) for nine basic mantle minerals with different crystalline structures at room temperature. Of those the lowest yield strength was found for periclase (18 kbar), the highest for grossular garnet (140 kbar), for olivines - 55 kbar, for pyroxenes - 60-70 kbar, for quartz - 95 kbar, for perovskites - 120-130 kbar. Our data agree, in principle, with the available data obtained by other methods [1-12].
Using a special technique of double-side laser heating in a diamond anvil cell when even comparatively thick powder samples are completely heated through their volumes with insignificant axial temperature gradients, we determined the yield strengths of olivine at 900K to be 22
68
kbar and for grossular: at 900K=80 kbar, at 1200 K = 55 kbar, at 1450K=40 kbar. An elevated temperature decreases substantially the yield strengths of minerals.
So, one more line of using of a diamond anvil cell opens up great possibilities in estimating plasticity of minerals and rocks under high P-T-parameters.
Fig.1. A scheme of the optical set up for transmittance and pressure measurements in a diamond anvil cell (DAC). P-pinhole, F - a set of filters with 25.50, and 75% of light transmission, PD-photodiode, VM-voltmeter, M-monochromator, PMT-photomultiplier, PC-computer.
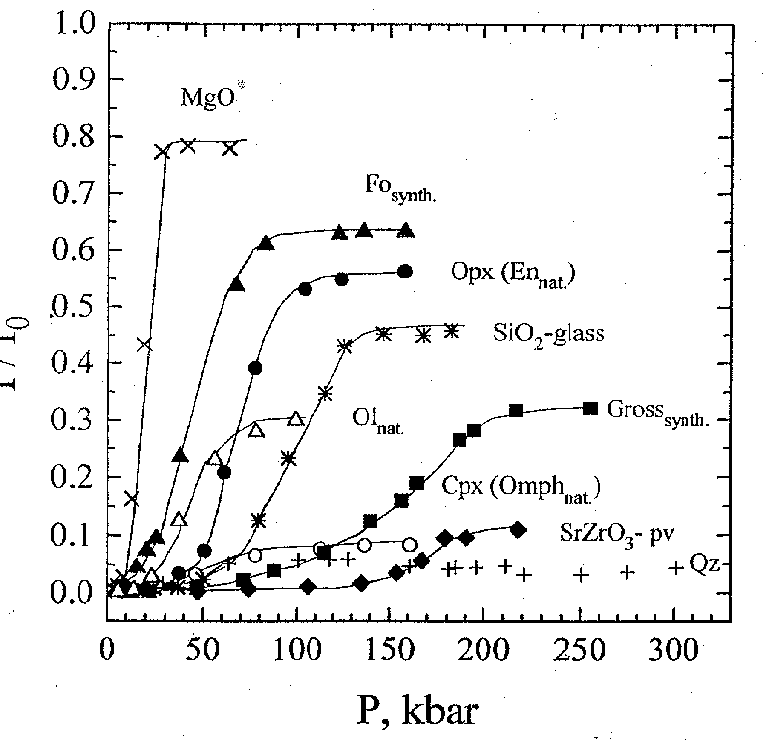
Fig.2. The transmittance vs pressure curves for minerals with the different crystal structures as a result of optical measurements in DAC at room temperature.
References:
Efimova1 G.A. , Kireenkova1 S.M. , Sobolev1 G.A., Sukhoparov2 V.A., Telepnev2 A.S. , Nikitin3 A.N. A high-temperature apparatus for defining elastic, deformational and textural characteristics of geomaterials by means of neutron diffraction method.
key words [high temperature apparatus deformation]
The high-temperature apparatus for unixial compression at forces up to 15-104 N is designed to deform polycrystalline samples of volumes up to 20 cm3 at temperatures up to 8000C. It represents a miniature hydraulic press, which is open for the neutron beam.
The classical techniques to investigate materials at high pressures and temperatures, and the principle determining textures by means of neutron diffraction are combined. This enabled us to place the high-temperature ap-
69
paratus on the SKAT texture diffractometer and to deform samples under different schemes of loading directly in the neutron beam.
SKAT represents a unique multidetector system, which was especially designed for pole figure measurements by means of neutron time-of-flight diffraction at beam 7 of the IBM-2 pulsed reactor in Dubna, Russia.
The axial force, temperature, hydrostatic pressure, deformation of sample and elastic wave velocities are measured continuously during the experiment. The experiment is filly remote controlled by a VME based measuring system.
In dependence upon the physical parameters mentioned above, time-of-flight spectra are recorded. They contain information about structural changes during an experimental run. First measurement were recently performed.
Kuryaeva R.G., Kirkinskii V.A. Optic methods of high-pressure study of minerals and glasses using a diamond anvil cell.
key words [optic method diamond anvil cell]Institute of Mineralogy, Petrology SB RAS 630090 Novosibirsk
Set-ups and techniques for optic studies of minerals under pressures to 10 GPa have been developed on the base of a diamond anvil cell [1].
A spectrophotometric block [2], incorporating a mirror monochromator SPM-2 with a flint glass prism, a light source, a fiber guid, a microscope provided with a photometric LUMAM-IZ attachment FMEL-1A, a system of signal registration, and a high-pressure diamond cell, enables one to obtain spectra of microsamples with a resolution 2.0-0.2 nm, in a spectral range 800-400 nm, with a 0.1 mm monochromator slit, in a pressure range 0-10 GPa. The sample compression is performed in a stainless steel spacer under hydrostatic conditions. The pressure is defined from a shift of the luminescence R1-line of ruby inserted into the spacer hole near to the sample. The pressure uncertainty is 0.1GPa. The spectra can be recorded both in polarised and nonpolarised light using a relative method. The standard is a pressure transmitting liquid surrounding the sample, namely, a methanol-ethanol mixture 4:1. The transmittance is calculated by the formula T=I/Io, where I and Io are the intensities of the light that passed through the sample and the standard, respectively.
In plotting the graphs the losses for reflection are accounted for by making use of a relative value of transmittance T/To, where To is the maximal transmittance of the sample in the spectral range under study.
The performed study of the absorption edge spectra of sulfides and sulfosalts of arsenic, recorded within 0 -10 GPa, suggests that the method has a good sensitivity and can be used to investigate direct and indirect interzonal transitions and to reveal reversible polymorphic transformations. In particular, for smithite 5 new high-pressure phases were found in the pressure range of 0-5 GPa. Their existence is confirmed by the Raman spectra [3] .
Using a high-pressure diamond anvil cell and an interference microscope, we have developed a technique for measuring the refractive index of isotropic materials under pressure [4]. Once the subject to be studied, with the refractive index nx , is placed into the field of vision of the microscope, the existing interference pattern displaces which enables the determination of the difference, due to this subject, in the F
course with respect to the environment with the know refractive index n, F
=(nx-n)t (1), where t is the thickness of the sample being studied. An interference microscope we used (MPI-5, Poland) makes it possible to carry out measurements with an uncertainly  F
=
F
= /75 at the wavelengths 590 nm and 546 nm.
In order to calculate the refractive index of the material under pressure, using formula (1), in addition to the measured difference in the course one has to known the refractive index of the environmental liquid under a particular pressure and the sample thickness under the same pressure.
The refractive index of the methanol-ethanol mixture 4:1 under pressure was obtained with an uncertainty
n=+0.004 at P=5.0 GPa [4], with diamond as a subject causing the occurrence of the difference in the course (the compressibility and refractive index of diamond are known in a broad range of pressures). The dependence of the refractive index on the methanol-ethanol 4:1 mixture obeys the equation  n102 =-2.22P+21.34P1/2-7.50P1/3 . (P, GPa). The change in the thickness of the plate being measured can be ignored since the experimental results have shown that the difference in the refractive indicates values for different substances, obtained with and without the account for the change in the thickness does not exceed 0.002 within 0-5.0 GPa , which may be taken into account in calculating the experimental error,
nx =
n +
F
/t +
tF
/t2 .
n102 =-2.22P+21.34P1/2-7.50P1/3 . (P, GPa). The change in the thickness of the plate being measured can be ignored since the experimental results have shown that the difference in the refractive indicates values for different substances, obtained with and without the account for the change in the thickness does not exceed 0.002 within 0-5.0 GPa , which may be taken into account in calculating the experimental error,
nx =
n +
F
/t +
tF
/t2 .
The investigation under pressure of SiO2-rich silicate glasses has shown that the maximal uncertainty in the determination of their refractive index does not exceed 0.007 in the pressure range under study, and the density, calculated using Muller's photoelasticity theory [5] agrees satisfactory with the experimental results.
References:
70
#
Zakirov I.V., Sretenskaya N.G., Zhdanov N.N. Experimental study of the effect of mixing of two compressed gases under near-critical conditions.key words [claster diffusion gases]
We have proposed a theoretical model of the dense gas state basing on the assumption that it comprises a broad spectrum of cluster structures from completely disordered ideal gas to condensate. The foundations of such approach were laid back in the works of Van-der-Waals, Vukalovich, Novikov, and Berezin. The theoretical analysis of the model has shown that nonideality of gases under near-critical pressures can be described by means of the cluster mechanism [1]. In our works [2,3] we reported our experimental results on rapid compression of pure carbon dioxide with the further analysis of the pressure and temperature relaxation curves which showed that the pressure relaxation curves had a distinct minimum at the background of the expected classic exponent. This fact points to the structural reconstruction of the gas and is a qualitative confirmation for the occurrence of clusters. So, it is logical to conjecture that upon the interdiffusion of gases under the conditions where one gas is ideal and the other one is non-ideal, the effect of their interaction ought to be manifested in an increase of the total pressure due to collapse of the cluster structures.
In order to verify these conjectures we devised the apparatus schematically illustrated in Fig.1. The apparatus consists of a reactor (1) with a built-in pressure transducer (4) and a thermocouple (5). A chamber (2) with a sensitive fluoroplastic membrane (3) is positioned inside the reactor. The volumes of the reactor and the inner chamber are approximately identical. The chamber (2) has a 3 mm dia opening closed with a special valve (11). The reactor is inserted in an air thermostat (10). In experiment the reactor is filled with carbon dioxide under specified pressure and temperature and with the valve closed. Then, at a constant temperature, argon is pumped in up to the pressure identical to the pressure of carbon dioxide. The elasticity of the membrane enables the pressure equalization with the accuracy of 0.04 at. So, the both gases are under the same pressure and at the same temperature. Then the gate (11) is opened and a slow interdiffusion of the gases occurs until they intermix completely.
In the process of experiment the signals from the pressure and temperature transducers enter a specially constructed system that involves a channel switch (7), A/D converter (8) and ADC controller built-in into a personal computer (9). An optronic isolation between the digital and analog parts of the apparatus protects against circuit interferences. In order to eliminate temperatural errors in the measuring channels their signal is periodically corrected against the stable reference voltage. The system enables pressure and temperature measurements every 10 ms with the sensitivity 4 torr and 0.02oC. The software enables putting-in into the computer memory the whole of the process for 1-2 h with every second averaging over 10 points.
The experiments were run at the 25oC isotherm under the pressures 30,40,50 and 60 at. The results are shown in fig.2. The plots are the screen dump of the continuous recording of the pressure (upper curves) and the temperature (lower curves) vs the time in seconds. As is seen, the temperature in the process of the experiment is virtually constant but the pressure explicitly grows up to some constant value. The effect of the pressure increment grows from 0.6 to 10 % as the initial pressure, i.e. CO2 density grows. Since with these parameters Ar is ideal and its density is practically constant, the observable effect may be attributed to the decrease of the extent of clasterization of the dense (nonideal) CO2.
References:
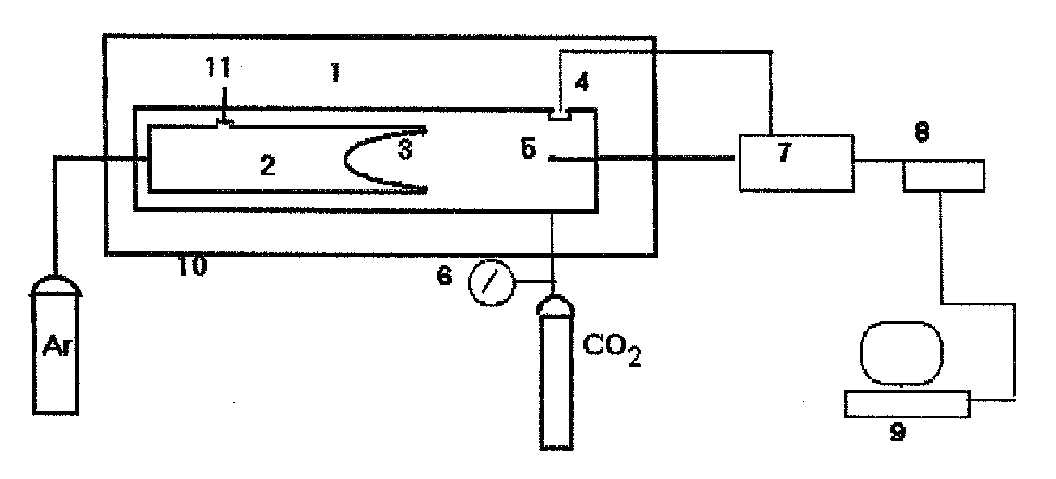
Fig.1. Schematic presentation of the apparatus. 1-Reactor, 2-inner chamber, 3-membrane, 4-pressure stransducer, 5-thermocouple, 6-Bourdon gauge, 7-channel switch, 8-A/D converter, 9-computer, 10-air thermostat, 11-valve.
# The work has been supported by the Russian Foundation for Basic Research
71
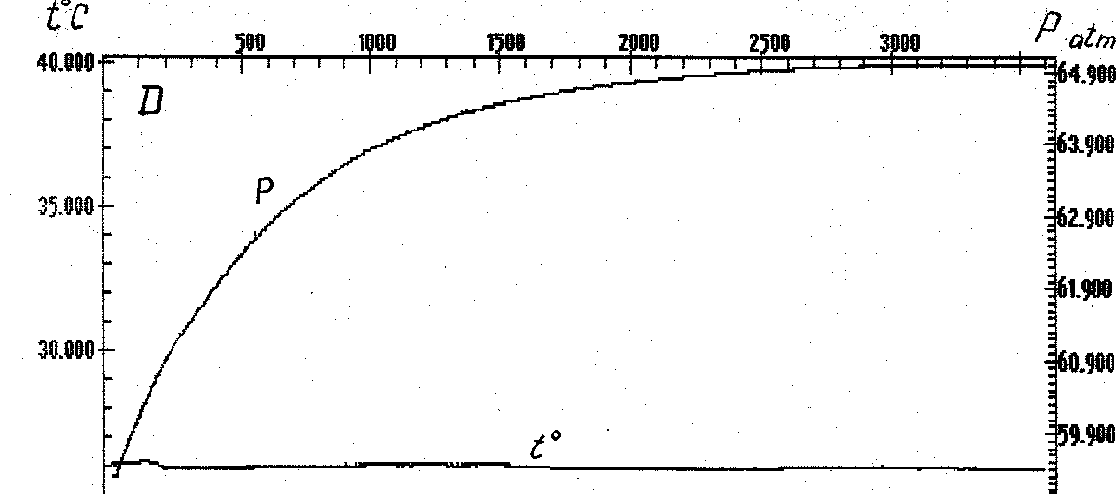
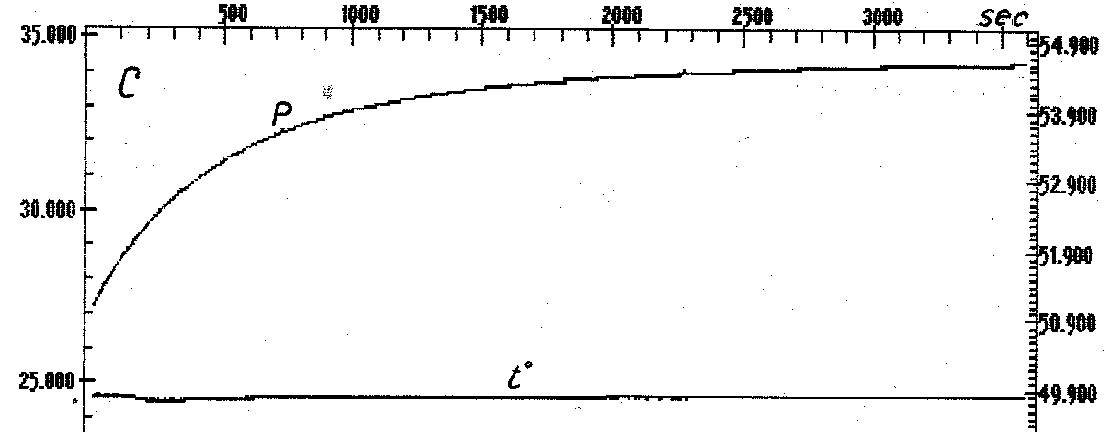
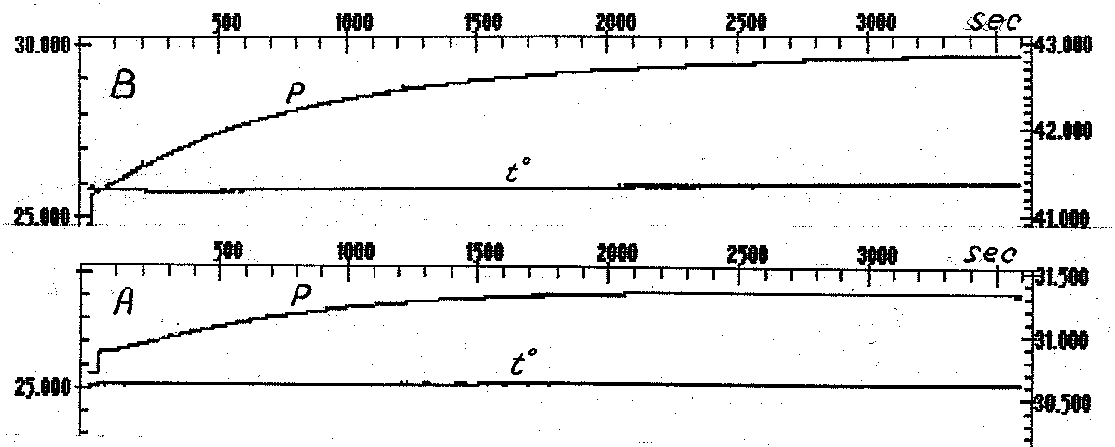
Fig.2. Temperature and pressure vs the time in the process of interdiffusion of CO2 and Ar under different pressures. (A-30 at, B-40 at, C-50 at, D-60 at.)
Samorodskii P.N. X-ray calculation microtomography in experimental mineralogy.
key words [microtomography gold arsenopyrite]
Chair of Dynamic Geology, Moscow State University; VNIIGEOSistem, Moscow, Russia
Possibilities to apply X-ray calculation microtomography (XCMT) in experimental mineralogy are considered using the rearrangement of gold in arsenopyrite from the Darasun deposit as an example.
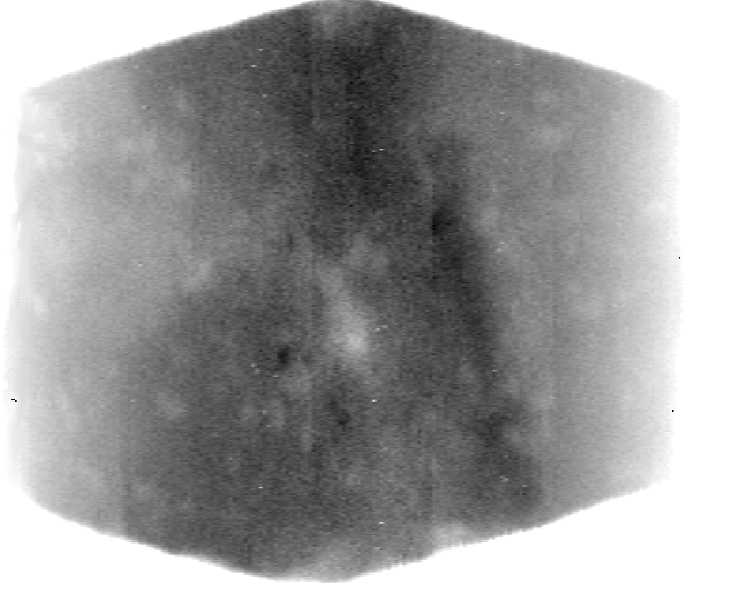
Fig.1. X-ray pattern of crystal auriferous arsenopyrite
72
The XCMT method reconstructs the spatial distribution of the linear attenuation coefficient (LAC) of X-ray radiation over the volume of the sample under study. The reconstruction is carried out due to mathematical processing of shadow projections obtained by X-ray "translucence" of an object in different directions of the cross section studied [2]. Heterogeneities in the sample structure are detected and studied by visual and computer analysis of the obtained images: X-ray and tomographic patterns. An image of the planar cross section of the reconstructed spatial structure of an object is named the tomographic pattern.
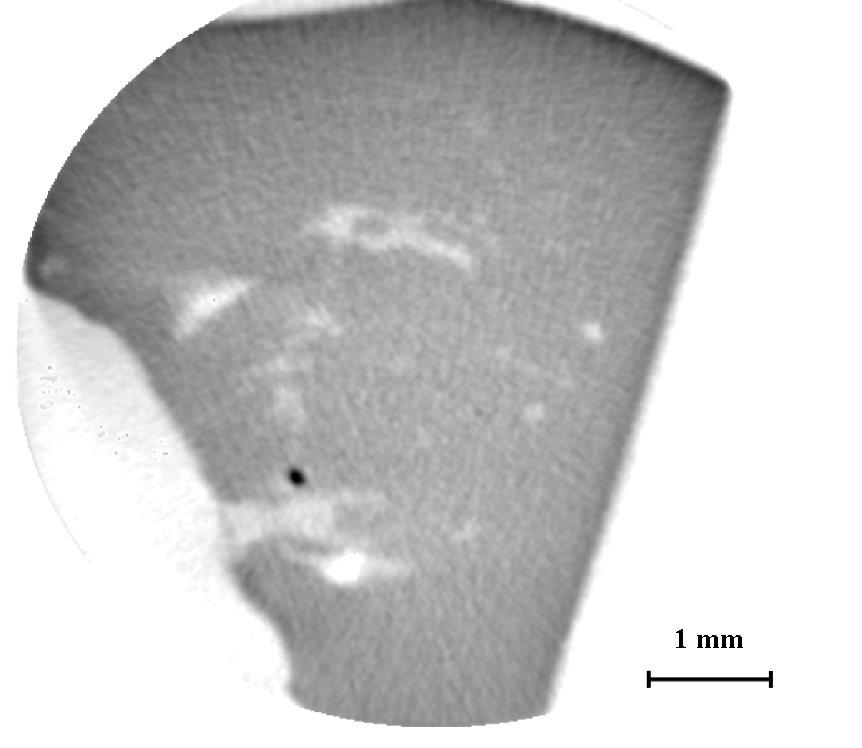
Fig.2. Tomographic pattern of the new gold particle in the arsenopyrite
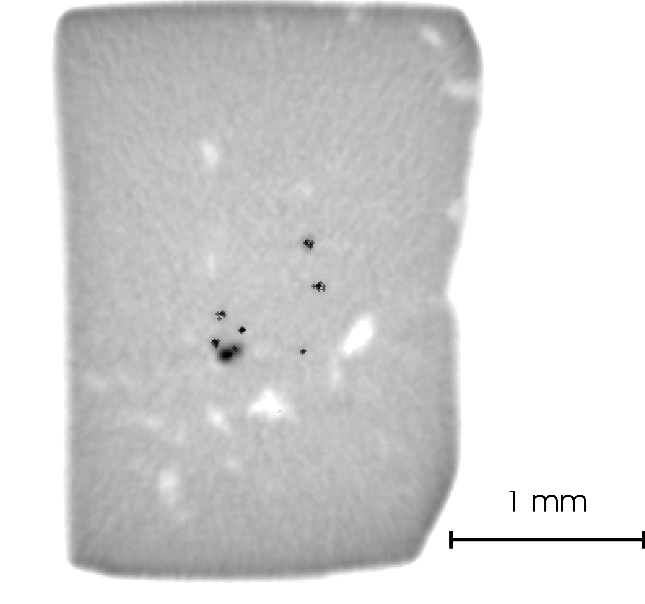
Fig.3. Tomographic pattern of gold particles in the arsenopyrite crystal
Fig.4. Schematic pattern of gold distribution in the arsenopyrite. The maximum of Au is in the centre of crystal.
Since LAC of a substance depends on the average atomic number (Z) and density ( ), the tomographic pattern obtained reflects the distribution of mineral precipitates, which differ by
and Z in the cross section considered. The values obtained are relative, but minerals can be reliably diagnosed due to standardization. Thus, we can "look inside" an optically nontransparent sample without disturbing its uniformity.
), the tomographic pattern obtained reflects the distribution of mineral precipitates, which differ by
and Z in the cross section considered. The values obtained are relative, but minerals can be reliably diagnosed due to standardization. Thus, we can "look inside" an optically nontransparent sample without disturbing its uniformity.
The phenomenon of enlargement of gold particles in sulfides on heating was studied [1] and used for investigation of the distribution of "invisible" gold in mineral-hosts (including for solution of technological problems). The traditional method of studying is based on heating of grind down samples of a gold-containing mineral followed by microscopic study of newly formed gold particles. This method has a substantial disadvantage: the real enlargement of gold particles in the mineral-host bulk cannot be evaluated.
Based on the results of the X-ray diffraction (Fig. 1) and tomographic studies of concretions of arsenopyrite crystals (Darasun deposit), we have chosen two samples: with gold particles and without them. The samples were repeatedly studied after heating at 360-365oC in an evacuated quartz ampule for a day.
Two newly formed gold particles were found in the sample that initially contained no gold: isometric and oblong particles (Fig.2). It is characteristic that in both cases, nucleation occurred at the boundary between arsenopyrite and the incorporated cericite-quartz material.
In the second case, the appearance of numerous finest (20-30  m) gold particles was observed in the previously existed gold plates against the background of some Au rearrangement (Fig.3). It is of interest that nucleation occurred in the central part of the arsenopyrite crystal inside the region surrounded by previously existed gold particles (Fig.4). A similar pattern of the Au distribution indicates that it was deposited during the arsenopyrite growth, and the concentration of gold reached some maximum (zone of large gold particles) and then decreased sharply ("empty" external zone of the arsenopyrite crystal).
Thus, the method of X-ray calculation microphotography can be successfully used in experimental mineralogy for studying nontransparent mineral associations without disturbing their uniformity.
References:
Galiulin R.V. Computer methods of search for minerals in microsections and geological outcrops using colour characteristics.
73
key words [colour mineral computer method]
Institute of Crystallography RAS 117333 Moscow Leninsky pr., 59
About 16 different colours are traditionally used in manuals of mineralogy to describe the colour of minerals. The present-day computer methods enable one to enlarger this palette a million times and to make it mathematically rigorous. Note, that not only a computer but, also, a normal human's eye is capable of distinguishing each of the million colours.
A mineral is introduced into a computer using a video camera or a scanner. A scanner can also be used to introduce into a computer photographs of the mineral. Even hand-operated colour scanners are able to fix the colour of grains starting with 0.01 mm, that is this size grain will correspond to one pixel on the screen. Each such pixel can be transformed via the image magnification to a square of about centimeter in size to deal with a mosaic of such squares.
The computer program designed to retouch photographs enables taking a colour characteristic from each screen pixel using the RGB, CMYK, and other standard diagrams, they yield co-ordinates of the point being investigated, distinguish all the remaining image points of the same colours. Given the appropriate data base one can automatically determine the minerals, the deposits wherefrom the specimen was taken, the confinement of the specimen, even of the one from which a product has already been made but the image of which is stored in the computer.
The same method can be employed to work with images of wall rocks introduced with a video camera into the computer. One can seek in the outcrops the desired minerals, their associations, find new associations and even new minerals. Having introduced directly from the quarry a video image into the INTERNET, one can involve into the work world's mineralogists concerned who, in the framework of teleconference, can just indicate the operators the angles at which would like to see certain parts of the mining. All those who wish to study eruptions or sea bottom rocks can also be involved. The information at the commercial production of minerals the greatest portion of which is but lost can also be stored. For example, even no photograph was left of the largest morion crystal found in Kent (Central Kazakhstan). These methods can be used to study pebble and sand bars on rivers, stamped rocks on escalators of concentration plants.
Fundamental researchers can also employ these techniques. It is yet unclear what mineralogic information is contained in the so-called optimal palette: representation of the rock by an ultimate set of colours, starting with one, for which there are special programs. Sometimes the optimal palette coincides with the colour which is assigned to the specimen by standard techniques and which figures in "Mineralogy". But sometimes the optimal palette is absolutely unlike the standard colour. For example, rhodonite with manganese oxide streaks is represented by grey colour (if the one-colour optimal palette is requested). The fractal characteristics of minerals can also be determined by these methods. The possibilities to vary the grain colours on the images enable one to model the physical states of the mineral, its colour reactions to different actions.
The mineral images obtained by the above described methods are so beautiful that they can be regarded as not only working drafts of a mineralogist, they render a certain aesthetic effect. The operation of such a great number of colours brings the produced mineral images closer to works of art. There appears a new line of art-mineralogic computer painting capable of affecting the development of the mineralogy itself in the aspect of its approximation to the humanities.
74